




Transforming Visual Merchandising: From Store Decoration to Data-Driven Science
Table of Contents
To this day, the majority of retail operators still treat Visual Merchandising (VM) as an “art” , a subjective blend of lighting, color schemes, and aesthetic decor whose success is measured by creative intuition rather than operational science.
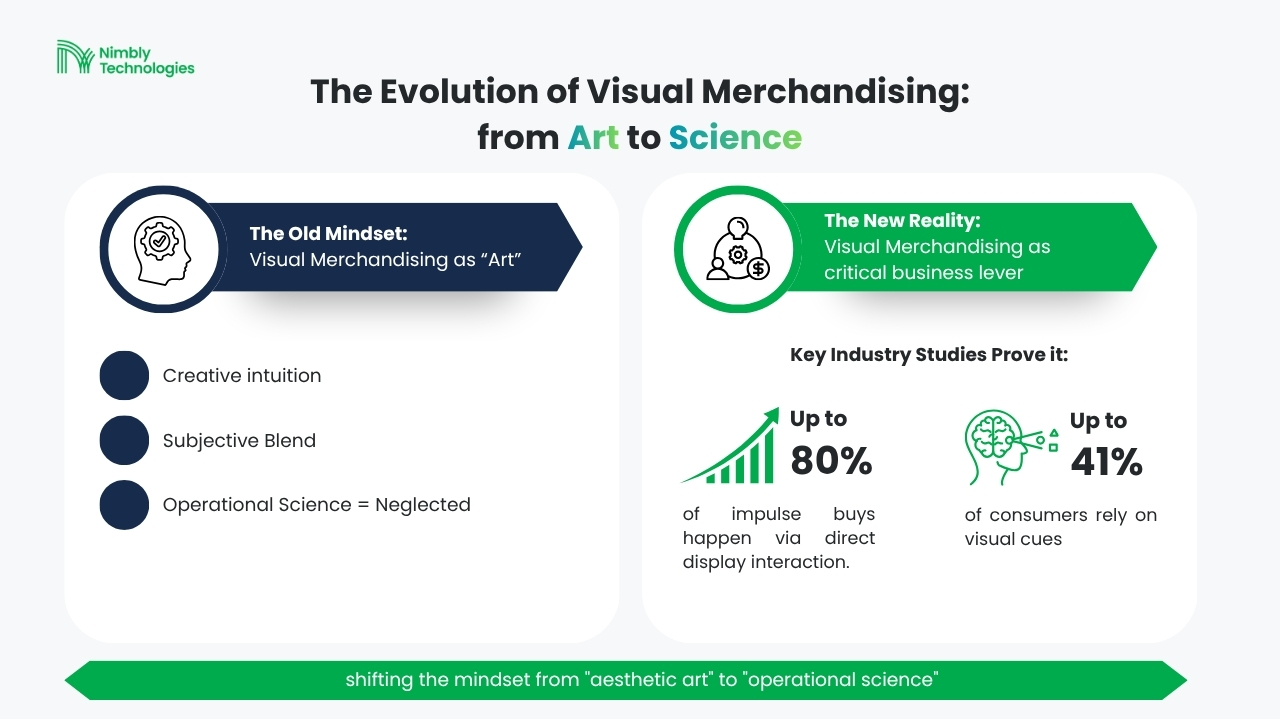
In reality, data shows that visual merchandising is a critical business lever for retail managers to capture customer attention, trigger impulse purchases, increase dwell time, and drive sales through measurable consumer behavior.
Studies by the ICSC and Wharton School reveal that up to 80% of impulse buying decisions occur spontaneously when consumers interact directly with product displays inside the store. This is supported by research indicating that 41% of consumers rely on visual cues to finalize their shopping choices.
Visual Merchandising clearly holds the key to the consumer’s final purchase decision. It is far more than passive decoration; shifting the mindset from “aesthetic art” to “operational science” determines whether prospective buyers simply walk past or become active foot traffic converted into revenue.
1. From Intuition to Analytics: How Retailers Evaluate Visual Merchandising Today
In the e-commerce landscape, no marketing team evaluates the success of a visual campaign banner solely by final sales revenue. They systematically track impressions and Click-Through Rates (CTR) to isolate variables, run A/B tests, and optimize creative assets with surgical precision. Physical retail, however, presents a stark contrast: to this day, most store operators still evaluate Visual Merchandising performance through a single, narrow lens: Point-of-Sale (POS) data.
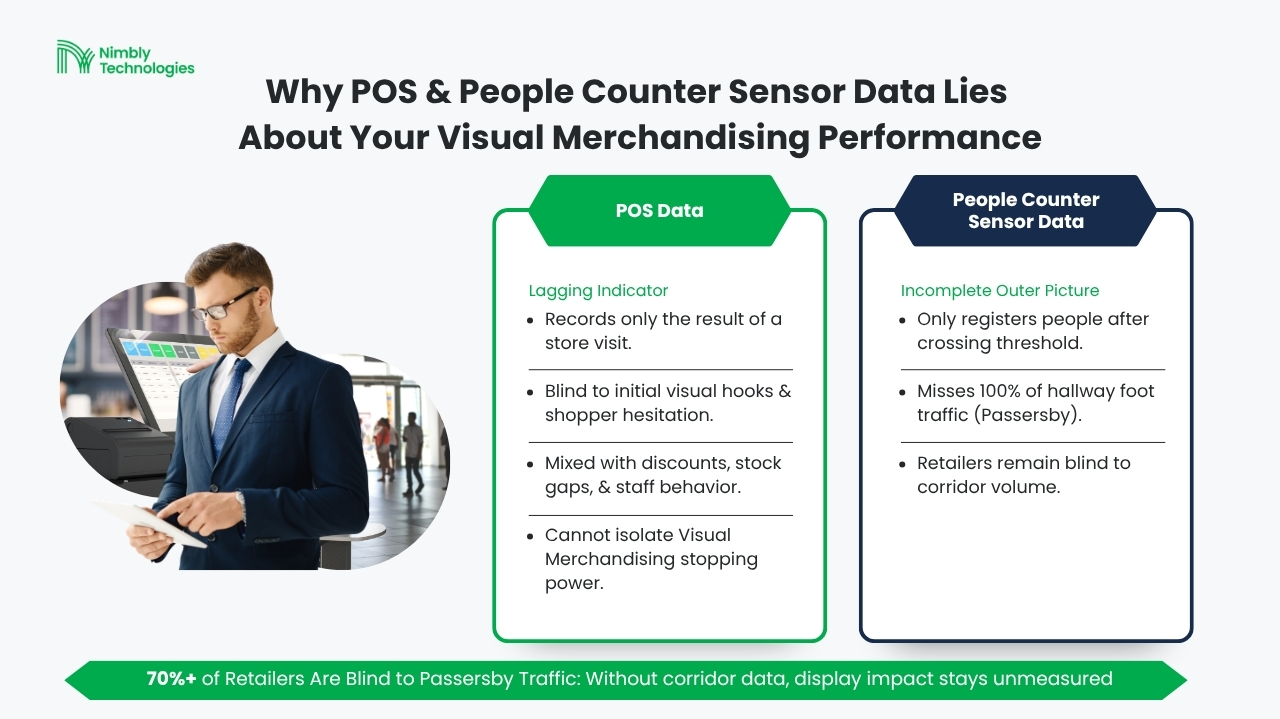
Relying exclusively on POS data to evaluate Visual Merchandising effectiveness is a fundamentally flawed approach. This dependency makes it virtually impossible for brick-and-mortar operators to run accurate A/B tests or optimize Visual Merchandising concepts based on proven performance. At its core, transaction data is merely a lagging indicator; it records the result of a visit but remains blind to initial visual hooks or shopper hesitation in front of a display.
Furthermore, a purchase decision at the checkout involves far too many confounding variables, ranging from promotional discounts and stock availability to staff friendliness. Measuring Visual Merchandising success solely through POS is like evaluating the quality of a billboard by sales at the cash register, without ever knowing how many people actually stopped to look at it.
Taking this a step further, some retailers attempt to measure Visual Merchandising effectiveness by implementing people counters. However, these conventional systems generally fail to capture the complete picture.
Technically, traditional people counters used by nearly 70% of physical retailers today still rely on hardware such as infrared doorway sensors (source: National Retail Federation & RetailNext). These methods suffer from a fundamental flaw: they only register individuals who have already crossed the store threshold. Consequently, they completely miss foot traffic flowing outside the window display (passersby).
Without comparative traffic data from the outer corridor, over 70% of retail operators report being blind to external foot traffic (source: NRF & RetailNext). Retailers remain unable to measure how effectively a display halts prospective buyers (stopping power), nor can they determine whether a dip in store visits stems from a failed Visual Merchandising design or simply a quiet mall corridor.
Beyond Door Sensors: Measuring Store Traffic with Wi-Fi Precision
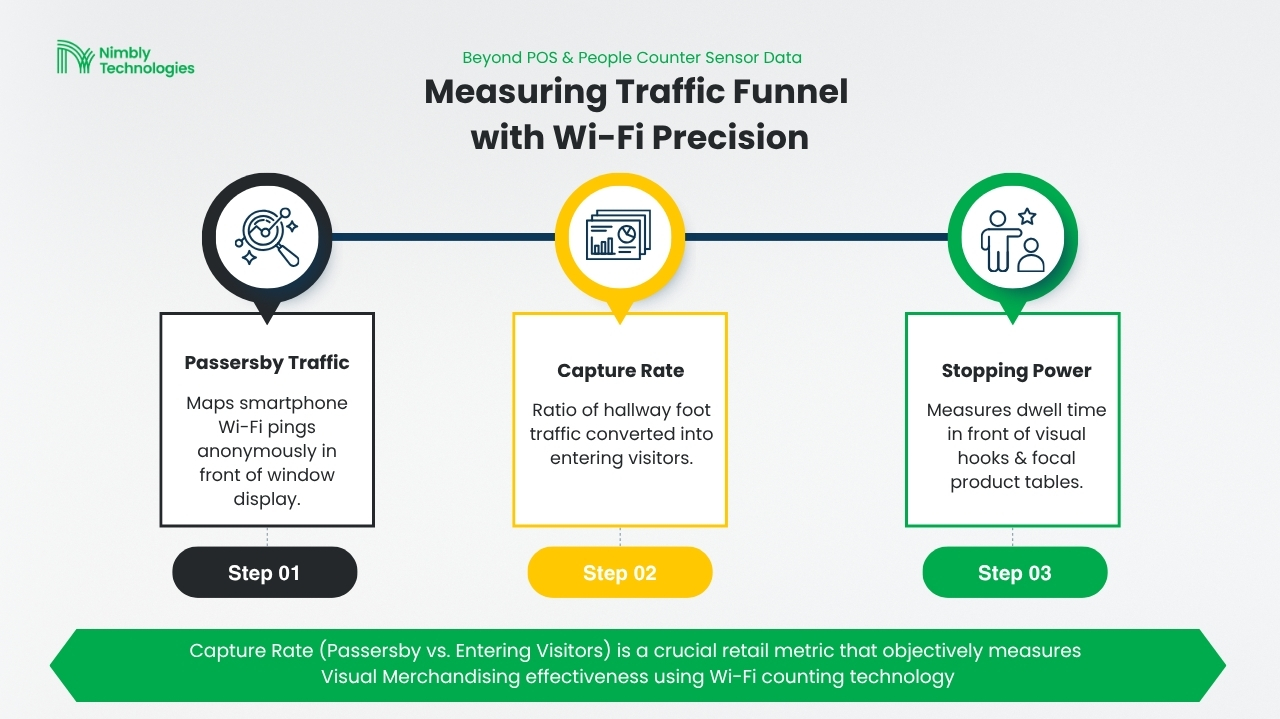
Unlike infrared sensors that are passive and bound to the doorway, Wi-Fi counting technology represents a major analytical leap in objectively measuring Visual Merchandising effectiveness. Where traditional door sensors act merely as digital tally counters, Wi-Fi analytics operates by capturing ping signals from shoppers’ mobile devices. These signals are constantly emitted by smartphones even when not connected to the store’s Wi-Fi network allowing operators to map the journey of prospective buyers from the outer corridor into the sales floor, accurately and anonymously.
The core strength of this approach lies in its ability to measure the shopper journey in a transparent, isolated manner. Beyond the store boundary, the system maps actual potential volume (passersby) while measuring customer dwell time in front of display windows. From this duration, retail teams can precisely differentiate between pedestrians who merely walk past, those who stop because a product arrangement catches their eye (stopping power), and those who are ultimately compelled to step inside.
Analyzing the ratio between external traffic and internal visitors gives birth to the most critical metric in modern retail science: Capture Rate (Passersby vs. Entering Visitors). This metric is the true physical counterpart of Click-Through Rate (CTR) in digital marketing.
Just as e-commerce measures how many users click a banner out of total impressions, Capture Rate measures how effectively a visual display converts hallway foot traffic into store visitors. Without this metric, retail operators are flying blind. They can never objectively isolate the root cause of underperformance: whether declining sales stem from a Visual Merchandising concept that fails to attract customers, or simply from reduced overall foot traffic in the shopping center.
2. The Execution & Compliance Challenge: Display Compliance as the Key to Visual Merchandising Performance
However, even when Capture Rate (passersby vs. entering visitors) can be tracked with precision, it represents only half of the customer journey data needed. Traffic metrics cannot stand alone without the complementary variable that dictates visual attraction quality itself: field execution compliance.
In digital advertising, a promotional banner uploaded from Headquarters (HQ) renders 100% identically across every user screen instantly, simultaneously, and flawlessly. Physical retail, by contrast, operates in a real-world environment heavily dependent on human coordination and execution. The same design concept sent from HQ is frequently interpreted differently, executed inconsistently, or outright derailed across hundreds of store branches. When the same visual concept is executed differently at every store, it naturally generates inconsistent consumer responses ultimately leading to a failed Visual Merchandising strategy.
Realities from the Field
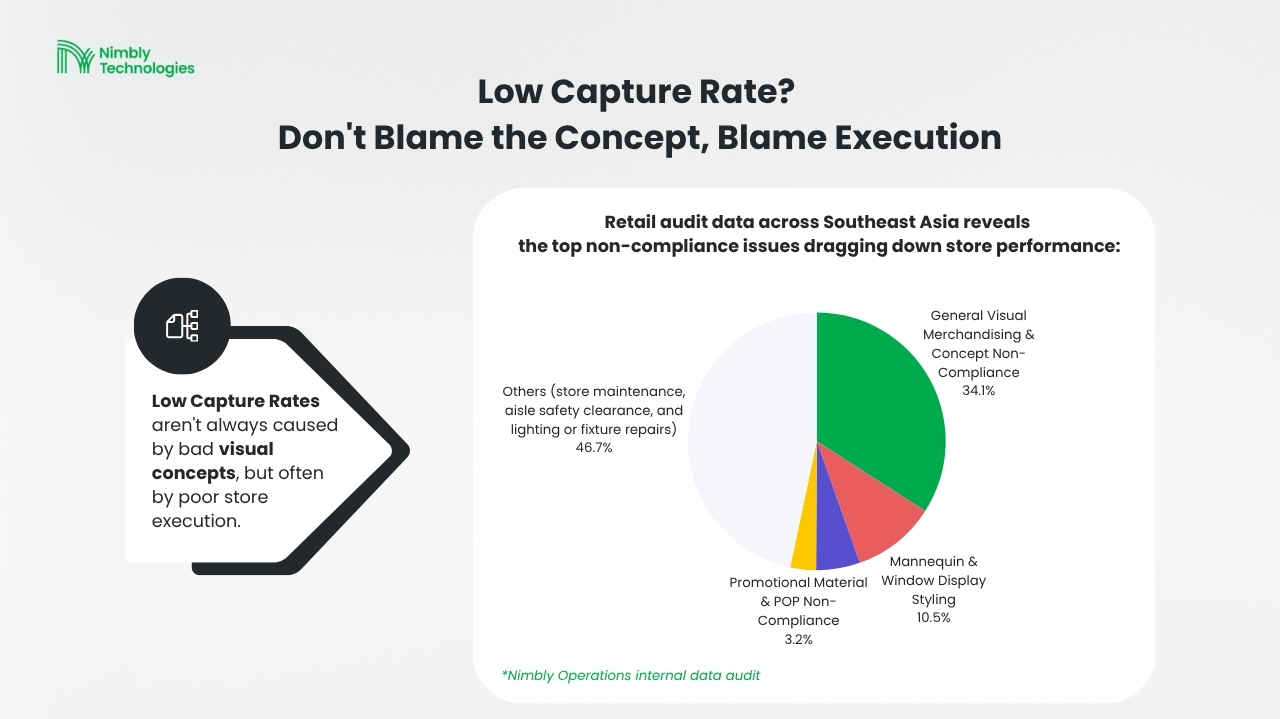
Field data shows that execution gaps are far from theoretical. Based on Nimbly Operations data regarding Visual Merchandising non-compliance issues in Southeast Asian physical stores, operational audits conducted by Area Managers and field auditors reveal five primary categories of non-compliance:
- 1. General Visual Merchandising & Concept Non-Compliance — 21.1%
- Workflow & Problem: Store teams misinterpret overarching visual concepts on the sales floor, such as incorrect product zoning or using unauthorized display fixtures.
- Coordination Dynamics: Resolving conceptual misunderstandings requires Area Managers to conduct re-briefings and staff re-education. Realigning store understanding takes an average of 5.5 days.
- 2. Mannequin & Window Display Styling — 6.5%
- Workflow & Problem: Mannequin styling diverges from lookbook guidelines (incorrect color coordination or accessories), garment folding lacks uniformity, or display shoelaces are untidy.
- Coordination Dynamics: Corrections require physical adjustments directly on the sales floor. Store staff align with centralized guidance to correct styling, taking an average of 3.2 days.
- 3. Planogram & Stock Discrepancies — 3.4%
- Workflow & Problem: Shelf product arrangements deviate from approved planograms, or high-impact focal tables suffer from empty display gaps (stock-outs).
- Coordination Dynamics: Resolving stock gaps requires cross-departmental escalation to Merchandising and Supply Chain teams for inventory replenishment or alternative planogram authorization. Involving physical logistics makes this the longest operational dependency, averaging 18.6 days.
- 4. Promotional Material & POP Non-Compliance — 2.0%
- Workflow & Problem: Point of Purchase (POP) signage is misplaced, price tags are missing/handwritten, or promotional posters are outdated.
- Coordination Dynamics: Store staff cannot resolve missing physical collateral on their own. The issue must be reported to HQ Marketing and re-printed by external vendors before being shipped to stores, stretching the procurement workflow to an average of 12.4 days.
(The remaining 28.9% of issues comprise routine store maintenance, aisle safety clearance, and lighting or fixture repairs).
The Operational Bottleneck: Why Visual Merchandising is a Cross-Functional Challenge
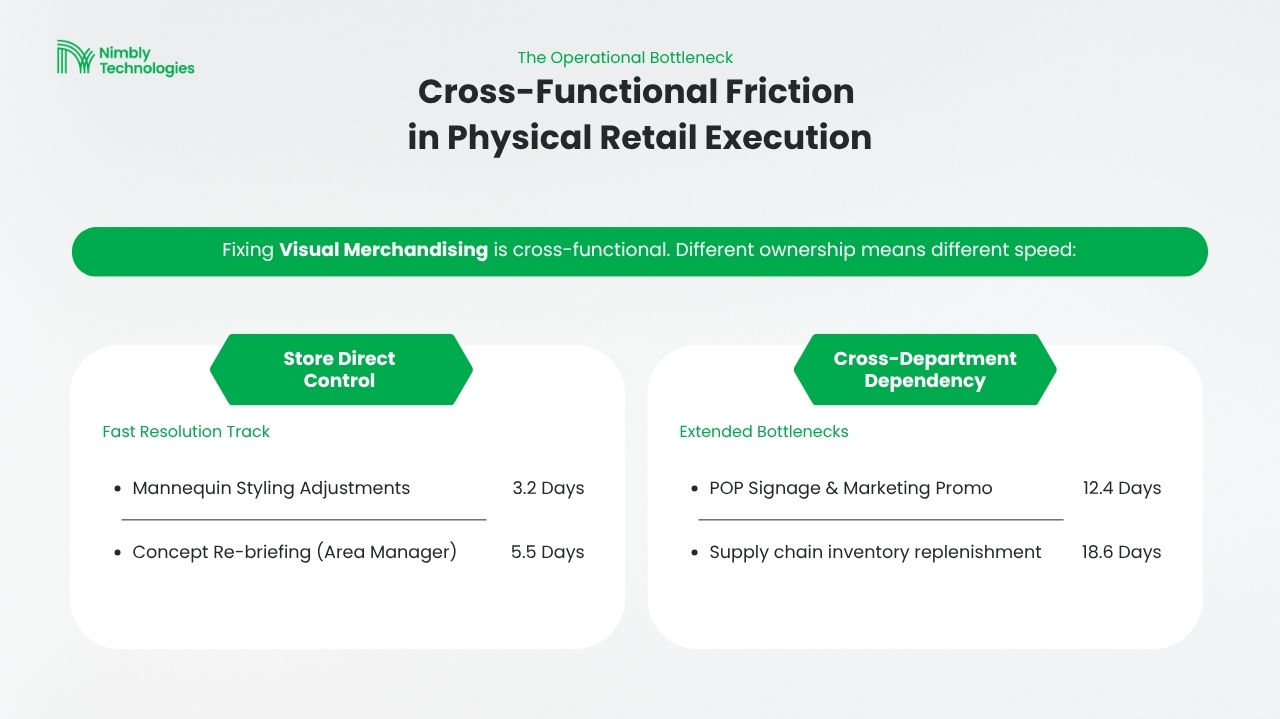
From these operational workflow, it’s clear that fixing a Visual Merchandising issue in a store isn’t just a frontline job. Whenever a discrepancy pops up on the sales floor, it takes a long chain of coordination involving store staff, Area Managers, HQ, Marketing, Supply Chain and even the Facility teams.
As field data demonstrates, when fixes remain within the store’s direct control such as re-styling a mannequin (3.2 days) store teams can detect and rectify errors rapidly. However, when an issue requires cross-departmental handoffs such as procuring marketing collateral (12.4 days) or awaiting supply chain inventory replenishment (18.6 days) the resolution timeline naturally extends.
Without an integrated communication channel and real-time visibility across all levels, retail managers face a massive decision-making risk: evaluating the wrong variables when measuring Visual Merchandising effectiveness.
When a new display concept is labeled a “failure” or deemed incapable of driving Capture Rate (passersby vs. entering visitors), HQ often rushes to overhaul the entire creative strategy and visual design. Yet data proves that underperforming Visual Merchandising on the sales floor rarely stems from poor creative design it breaks down at the communication bottleneck and daily execution failures at the store level.
Ultimately, for physical retail operators, this operational truth is undeniable: Visual Merchandising impact is not decided on the design board; it is decided by execution compliance (It’s not the design, it’s the execution).
3. How Large-Scale Retailers Manage Visual Merchandising
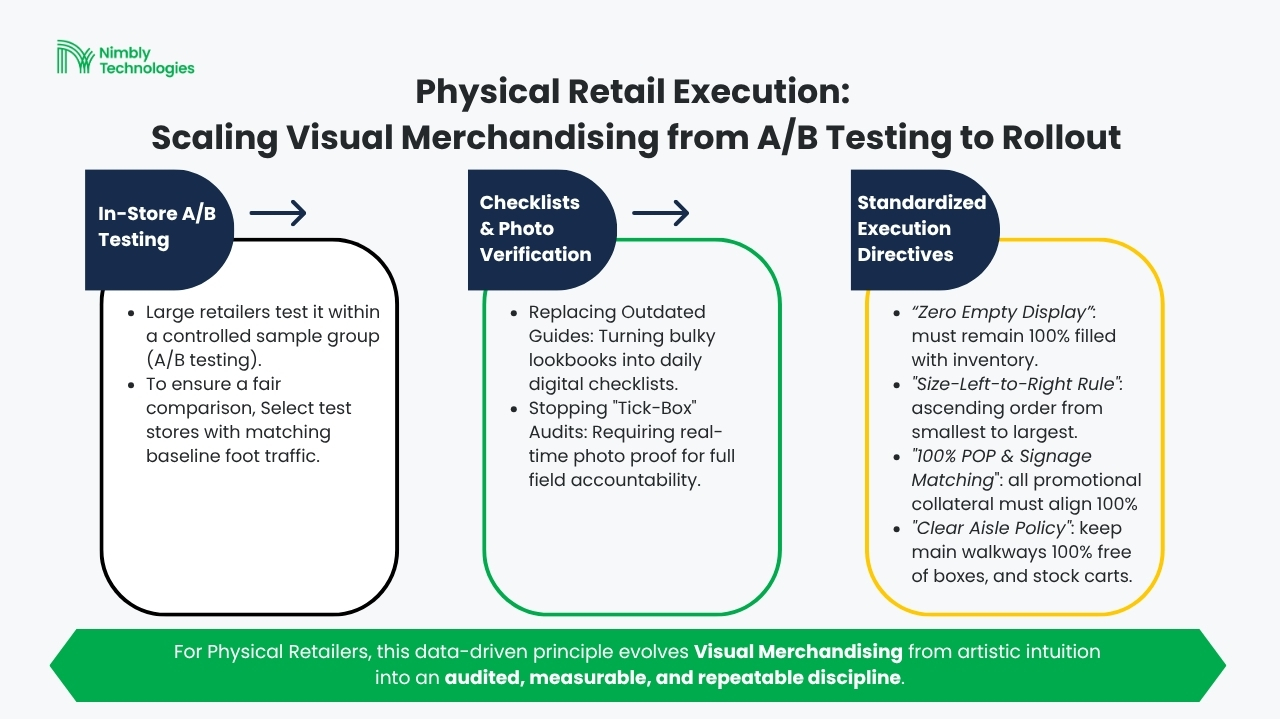
In digital advertising, marketers run A/B tests to compare two different ad creatives and identify which drives more conversions. This data-driven principle is now embraced by modern physical retailers. For them, Visual Merchandising is no longer about artistic intuition, but an audited, measurable, and repeatable business discipline.
Before rolling out a new visual design across hundreds of stores (global rollout), large retailers test it within a controlled sample group (A/B testing). To ensure a fair comparison, they select test stores with equivalent baseline foot traffic. This way, if sales surge in stores featuring the new visual arrangement, HQ knows with certainty that the lift was driven by the Visual Merchandising display not simply because the store had higher natural foot traffic.
However, these tests are only valid if sample stores execute the visual displays with 100% precision. This is where digital audits become non-negotiable. Nimbly Operations data reveals a high concentration of compliance issues precisely in these high-impact store zones (window displays and focal tables). If staff at sample stores fail to execute displays according to testing guidelines, the A/B testing data becomes corrupted, leading HQ to flawed business decisions.
Once a new Visual Merchandising design proves its ability to drive sales during A/B testing, the real operational challenge begins: replicating that exact standard uniformly across every branch.
Large retailers lock in compliance by translating visual concepts directly into a daily SOP framework based on actionable checklists paired with mandatory photo verification.
This approach replaces verbal instructions or bulky lookbook documents that are easily ignored in the field. New visual guidelines are converted into practical daily checklists easily digested by frontline staff. Consequently, every morning before store doors open, staff know precisely which operational points must be checked from storefront neatness and spotlight alignment to product arrangements on focal tables.
Yet, a paper checklist alone does not guarantee real-world compliance. Enterprise retailers enforce accountability through mandatory photo verification. Store staff are required to upload real-time photo proof for every critical checkpoint on the list. This step ensures that every display corner on the sales floor is executed to HQ standards, rather than treated as a tick-box exercise.
Systematic photo verification ensures that high-performing visual standards established during A/B testing do not drift when deployed at scale.
Clear Directives & Precision Phrasing
The effectiveness of daily checklists depends heavily on how easily instructions are understood by frontline staff. Overly theoretical visual guidelines or design jargon frequently invite misinterpretation on the sales floor. To eliminate ambiguity, leading retailers use concise, explicit, and action-oriented phrasing (unambiguous phrasing).
Common standardized phrasings used by major retailers to control sales floor execution include:
- “Zero Empty Display”: Focal tables and primary window displays must remain 100% stocked with physical inventory (no empty gaps), unless explicitly authorized in writing by HQ Visual Merchandising.
- “Size-Left-to-Right Rule”: Clothing sizing on hanging racks must strictly follow an ascending order from smallest to largest, reading from left to right.
- “100% POP & Signage Matching”: All promotional collateral, price tags, and digital screen media must align 100% with the active marketing campaign guide.
- “Clear Aisle Policy”: Primary customer traffic aisles must remain 100% clear of unboxed inventory, stock carts, or temporary display fixtures.
Closed-Loop Issue Resolution with Clear IRR Targets
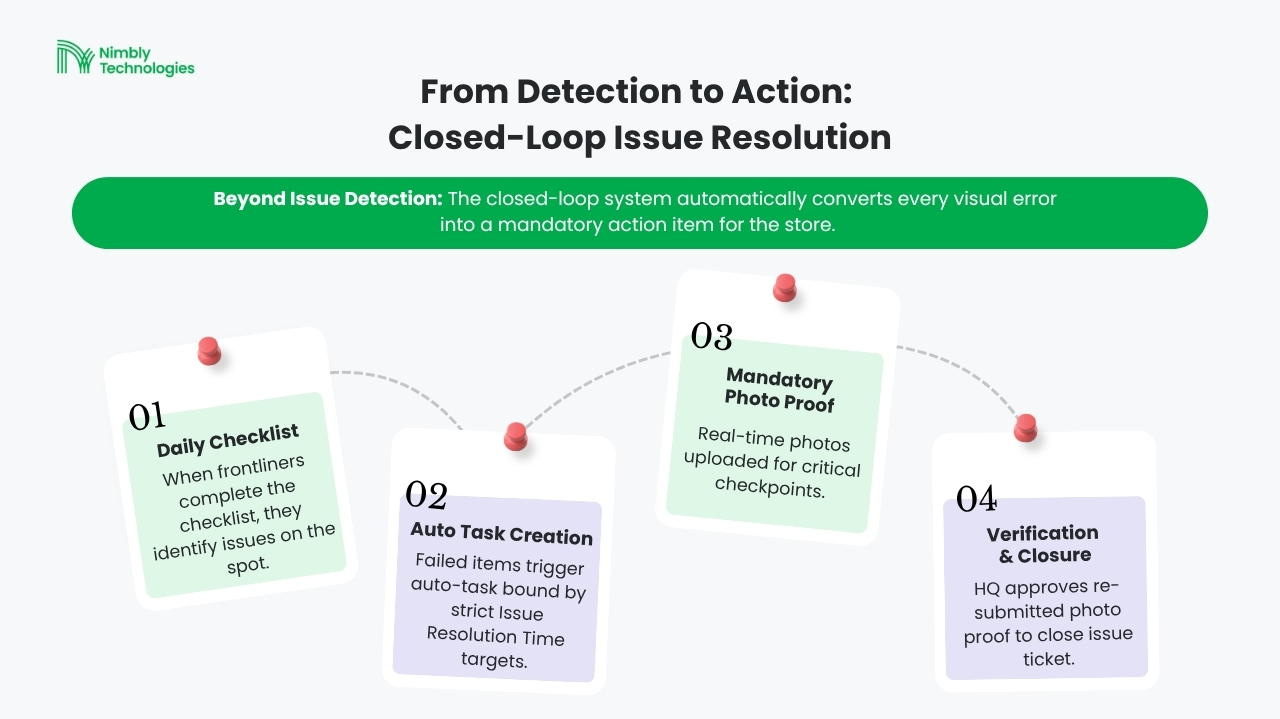
When checklist submissions uncover visual errors in-store, the operational workflow must not stop at mere issue identification. Modern retailers implement a closed-loop issue resolution system. Every detected error automatically generates an outstanding task for the store, which remains open until corrective photo proof is re-submitted and approved by HQ.
To ensure corrective tasks are not neglected, HQ sets unambiguous operational KPIs: a target percentage for mandatory task completion (Issue Resolution Rate / IRR) alongside a maximum allowable timeframe for rectification (Issue Resolution Time / IRT).
Nimbly Operations data illustrates how enterprise retailers measure and manage store resolution speed across different issue complexities:
- Frontstore & Mannequin Corrections: Styling errors on mannequins or window display discrepancies (Window Display Violations) are resolved within an average of 3.2 days.
- Broad Visual Concept Alignments: Broader layout discrepancies (General Visual Merchandising Non-Compliance) require a longer turnaround, averaging 5.5 days. This extra time accounts for HQ briefing and staff re-education required to prevent recurring mistakes.
A closed-loop reporting mechanism backed by clear IRR targets ensures that every field visual defect is systematically rectified—rather than lingering as unaddressed data on a report.
4. How Nimbly Helps Close the Visual Merchandising Execution Gap
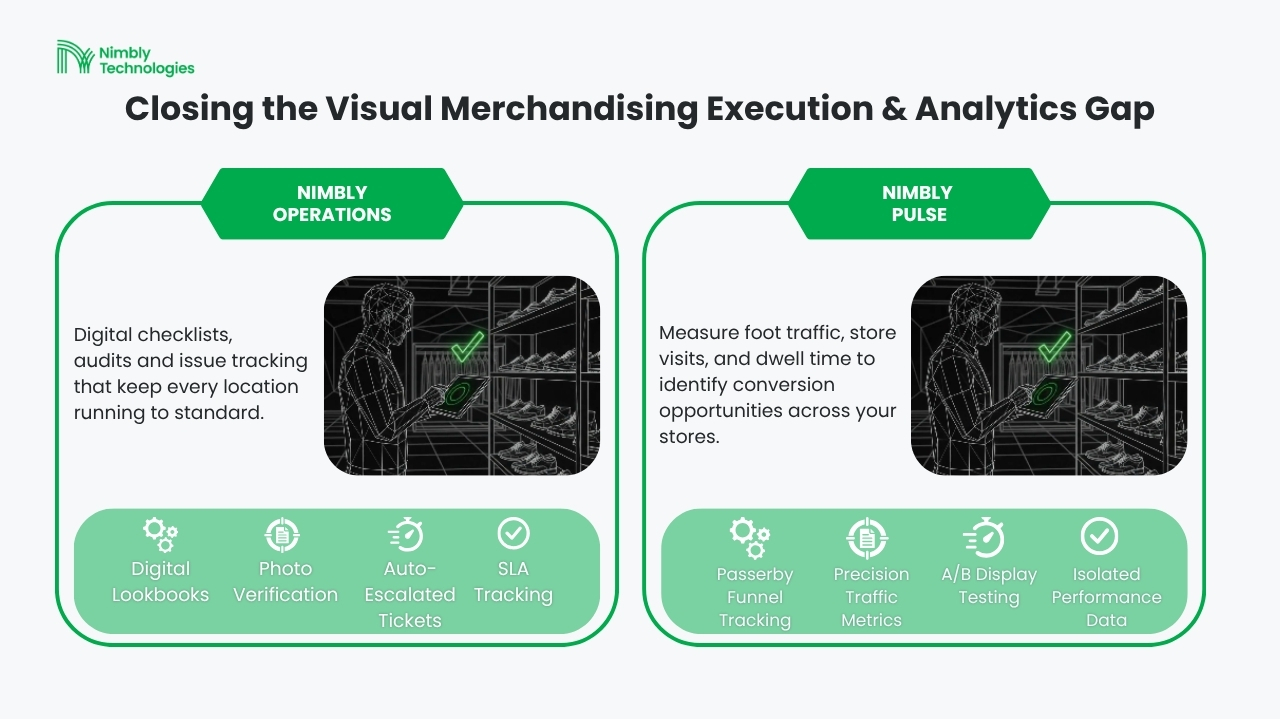
The execution gap between ideal Visual Merchandising concepts developed at HQ and real-world execution on the store floor stems from two root causes: weak operational compliance controls in the field and lack of real-time shopper analytics. Relying on manual workflows, paper checklists, or random field inspections prolongs Issue Resolution Time (IRT) and leaves untapped revenue on the table.
To close this gap in a measurable way, Nimbly provides an integrated technology platform that streamlines workflows from frontline staff up to executive leadership:
1. Nimbly Operations: Digitalizing Visual Merchandising Compliance & Daily Checklists
Bulk lookbooks and paper checklists fail to enforce compliance across hundreds of store locations. Through Nimbly Operations, HQ translates visual guidelines into an intuitive Digital Visual Merchandising Checklist tailored for frontline execution.
Based on internal Nimbly Operations data, standardized Visual Merchandising compliance checkpoints required for store teams include:
- Is spotlight illumination on the window display 100% operational and focused directly on hero products?
- Is physical stock on the focal table 100% filled with zero display gaps (Zero Empty Display)?
- Are promotional signage (POP) and price tags 100% aligned with the active campaign period?
The field management process is streamlined for daily store operations:
- Execution Simplicity & Photo Verification: Every morning before opening doors, store staff open the Nimbly app to complete their daily checklist. Each checkpoint mandates attaching real-time photo proof of execution.
- Closed-Loop Resolution: If a checkpoint is marked “Non-Compliant” or photo proof fails standard, Nimbly Operations automatically converts the flag into an actionable issue ticket bound by transparent resolution timelines (SLAs).
2. Nimbly Pulse: Measuring Traffic, Entry Rate & Display Impact
Evaluating Visual Merchandising must extend beyond operational compliance rates; it must demonstrate tangible impact on shopper behavior. Nimbly Pulse bridges physical display execution with real-time foot-traffic analytics:
- Tracking the Full Conversion Funnel: Nimbly Pulse accurately captures the volume of pedestrians passing the store (Passing Traffic), shoppers who step inside (Store Visitors / Entry Rate), and those who complete a purchase (Purchase Conversion).
- Validating Entry Rate Impact: Through the Entry Rate metric (ratio of entering visitors relative to passing traffic), HQ teams can directly validate the stopping power of new window displays, focal tables, or campaign launches during A/B testing. An uptick in Entry Rate serves as concrete proof that a visual concept successfully captures consumer attention.
World-class Visual Merchandising execution is not driven by luck; it is built on measurable operational discipline. By combining digital checklist compliance via Nimbly Operations with precision shopper analytics from Nimbly Pulse, modern retailers no longer guess their visual effectiveness—they control it, close every operational gap, and ensure every square foot of the sales floor maximizes profitability.
We would love to partner with you to streamline your operations. Request a free consultation today to get started!